
One unified analytics platform, built on Microsoft Fabric.
End-to-end Microsoft Fabric implementation and enablement.

Overview
Placeholder overview: we implement Microsoft Fabric as the unified platform for data engineering, data warehousing, real-time analytics and BI — replacing disconnected tools with one governed lakehouse your teams can build on.
What's included
Key capabilities
Fabric lakehouse implementation
OneLake data architecture
Data pipeline & Dataflow development
Real-time analytics
Power BI semantic modeling
Fabric governance & capacity planning
The impact
What this typically looks like
How we work
Our process
Our process: Assess → Architect → Implement → Migrate → Enable
- 1
Assess
Review existing data estate and Fabric readiness.
- 2
Architect
Design the lakehouse, workspaces and capacity plan.
- 3
Implement
Build pipelines, datasets and semantic models in Fabric.
- 4
Migrate
Move existing workloads and reporting into Fabric.
- 5
Enable
Train teams and hand over a governed Fabric environment.
Tech stack
Tools & platforms
- Microsoft Fabric
- OneLake
- Power BI
- Azure Synapse
- Azure Data Factory
- Azure
Proof
Related case studies
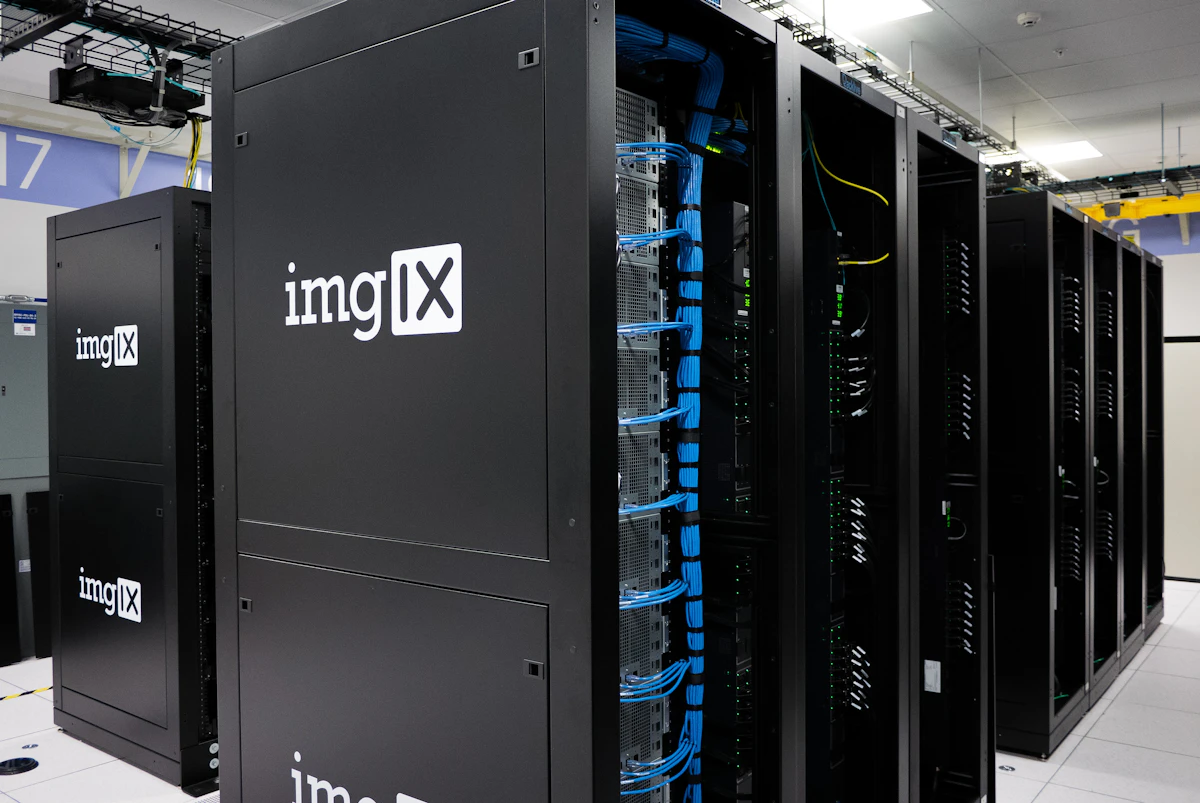
A single, trusted data warehouse for enterprise reporting
Reporting pulled from a dozen source systems with no shared definitions, so every team trusted a different number.
12
Source systems consolidated
Modernizing analytics with Microsoft Fabric
Legacy, siloed data warehouses were slow to query and expensive to maintain across multiple production sites.
50%
Faster dashboard load times

A governed semantic model on Microsoft Fabric for enterprise-wide reporting
Every department had built its own Power BI measures for the same metrics, so a single term like "on-time delivery" meant something different in every report.
1
Certified semantic model replacing dozens of duplicated measure sets

Four connected dashboards giving a telecom provider one source of truth
Sales, network build-out, finance and field operations each tracked performance in separate spreadsheets, so leadership had no single, current view of the business.
4
Connected dashboards replacing dozens of spreadsheets
FAQ
Frequently asked questions
How is Microsoft Fabric different from our existing Power BI setup?
Placeholder answer — to be replaced with real platform comparison details.
Can Fabric replace our current data warehouse?
Placeholder answer — to be replaced with real migration guidance.
What licensing / capacity do we need to get started?
Placeholder answer — to be replaced with real licensing guidance.
Get started
Ready to talk about microsoft fabric?
Tell us about your goals and we'll help you find the right approach.