
Results we've delivered across industries.
Selected engagements across data, finance and engineering — illustrative examples of how we work.
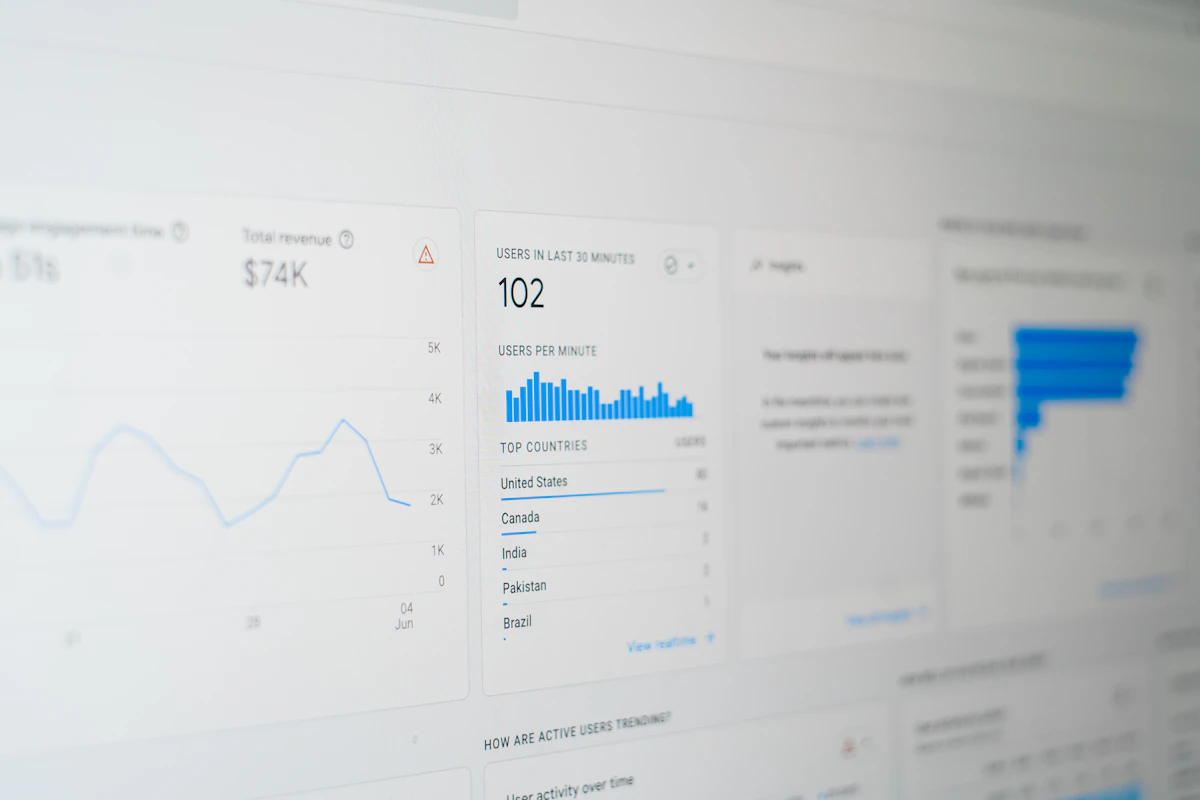
A unified analytics view across sales and operations
Reporting was spread across spreadsheets and disconnected tools, so leadership couldn't get a single, trusted view of performance.
40%
Reduction in manual reporting time

Connected financial reporting for a growing business
Finance closed the books using manual spreadsheet consolidation, which delayed reporting and introduced errors.
3x
Faster monthly reporting cycle
A single, trusted data warehouse for enterprise reporting
Reporting pulled from a dozen source systems with no shared definitions, so every team trusted a different number.
12
Source systems consolidated
Modernizing analytics with Microsoft Fabric
Legacy, siloed data warehouses were slow to query and expensive to maintain across multiple production sites.
50%
Faster dashboard load times

Automating accounts payable from invoice to reconciliation
Accounts payable was entirely manual, from invoice entry through approvals and reconciliation, creating delays and errors.
70%
Reduction in manual AP processing time

Rebuilding internal tools for a faster, more reliable frontend
An aging internal tools frontend was slow and error-prone, slowing down the teams who depended on it daily.
2x
Faster page load times

A modern lakehouse architecture replacing five legacy warehouses
Five regional data warehouses had grown independently over a decade, each with its own definitions, refresh schedules and access model — reconciling them for a single group-wide report took days.
5→1
Regional warehouses consolidated into one lakehouse

Migrating from on-premises SQL Server to a governed cloud warehouse
An aging on-premises SQL Server warehouse was expensive to maintain, slow under load and had no documented data lineage — every schema change risked breaking a downstream report.
100%
Legacy on-prem infrastructure decommissioned

A governed semantic model on Microsoft Fabric for enterprise-wide reporting
Every department had built its own Power BI measures for the same metrics, so a single term like "on-time delivery" meant something different in every report.
1
Certified semantic model replacing dozens of duplicated measure sets

Four connected dashboards giving a telecom provider one source of truth
Sales, network build-out, finance and field operations each tracked performance in separate spreadsheets, so leadership had no single, current view of the business.
4
Connected dashboards replacing dozens of spreadsheets

Consolidating four QuickBooks entities into one reporting view
Four regional entities each ran their own QuickBooks file, so producing a consolidated group P&L meant exporting and manually merging spreadsheets every month.
4→1
QuickBooks entities consolidated into one view

Automating a Sage month-end close from ten days to three
Month-end close relied on a manual checklist spread across email and spreadsheets, so it regularly slipped past the tenth working day.
10→3
Days to close, cut from ten to three

Multi-currency Xero automation for a fast-growing e-commerce brand
Selling in six currencies through three marketplaces meant daily manual entry and constant reconciliation errors between Xero and the sales channels.
90%
Reduction in manual transaction entry

An AI agent that triages and routes support tickets automatically
Support tickets were manually triaged by a team lead every morning, delaying urgent issues and burning hours on repetitive categorization work.
85%
Tickets triaged automatically within a minute

AI-powered invoice processing cutting manual data entry to zero
Hundreds of supplier invoices arrived every week in different formats, and a team member manually keyed each one into the accounting system.
0
Manual line items keyed since go-live

AI-generated weekly reports replacing a two-day manual process
Every Monday, an analyst spent two full days pulling numbers from six platforms into a client-facing report deck.
2 days → 1 hour
Weekly reporting time

A mobile ordering app for a multi-location coffee shop chain
In-store queues at peak hours were driving customers away, and the chain had no way to offer online ordering across its locations.
30%
Of orders now placed through the app

A fast, conversion-focused website for a growing burger restaurant brand
The old website took over eight seconds to load on mobile, had no online ordering link, and was losing visitors before they ever saw the menu.
8s → 1.2s
Mobile page load time
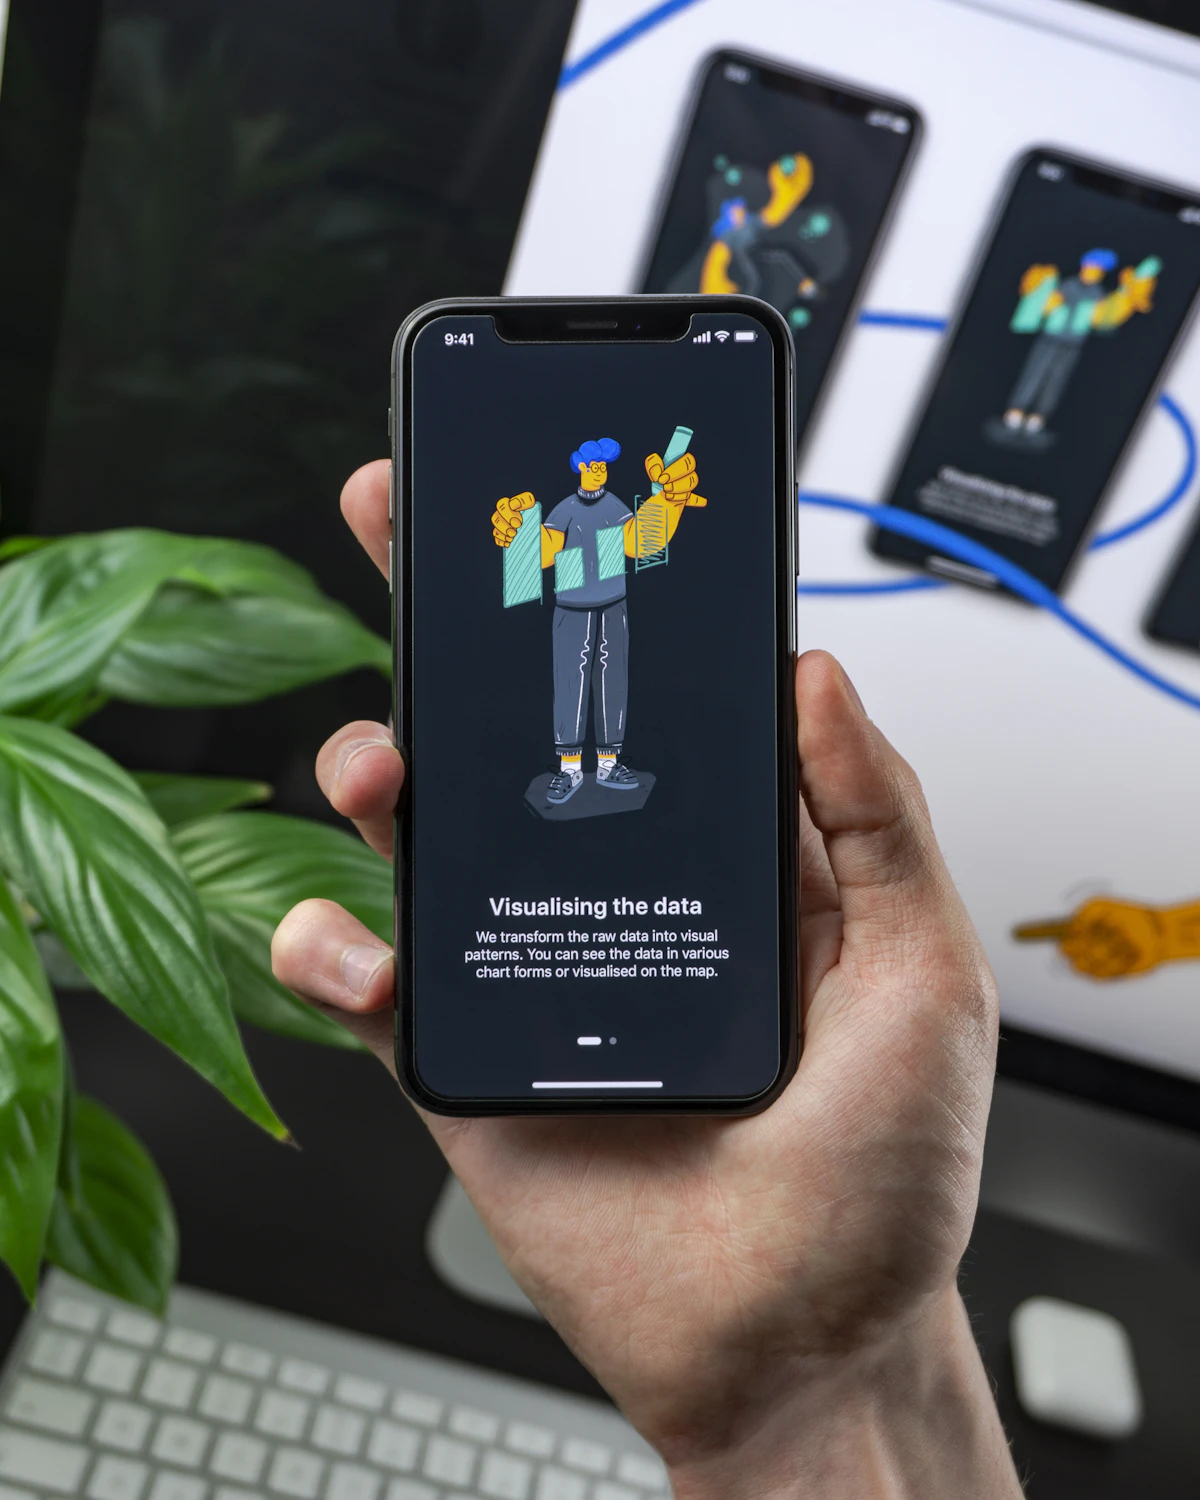
A booking and membership app for a boutique fitness studio
Class bookings were managed through a mix of spreadsheets and phone calls, causing double-bookings and no-shows the studio had no way to track.
0
Double-bookings since launch
“Reporia & Chartedly transformed our reporting from manual spreadsheets to real-time dashboards. Decision-making is dramatically faster now.”
Get started
Have a similar challenge?
Tell us about your goals and we'll help you find the right approach.